Predictive Maintenance ROI: What It Really Pays Back, With Numbers
By Henry — 2026-11-04
Defensible benchmark ranges, a simple payback calculation and the four mistakes that kill the predictive maintenance business case.
Every predictive maintenance vendor promises a 10x return. Few can show where the number comes from. This article gives the ranges you can defend in a budget meeting, a simple payback calculation and the pitfalls that kill the business case.
Why unplanned downtime is the number to beat
Siemens and Senseye’s 2024 True Cost of Downtime study estimates unplanned downtime costs the Fortune Global 500 about $1.4 trillion a year, roughly 11% of revenue. Deloitte notes that poor maintenance strategies can cut an asset’s productive capacity by 5% to 20%.
Your plant is not a Fortune 500, but the logic holds: one stop of your bottleneck line costs far more than the sensor that would have flagged it.
What the studies actually show
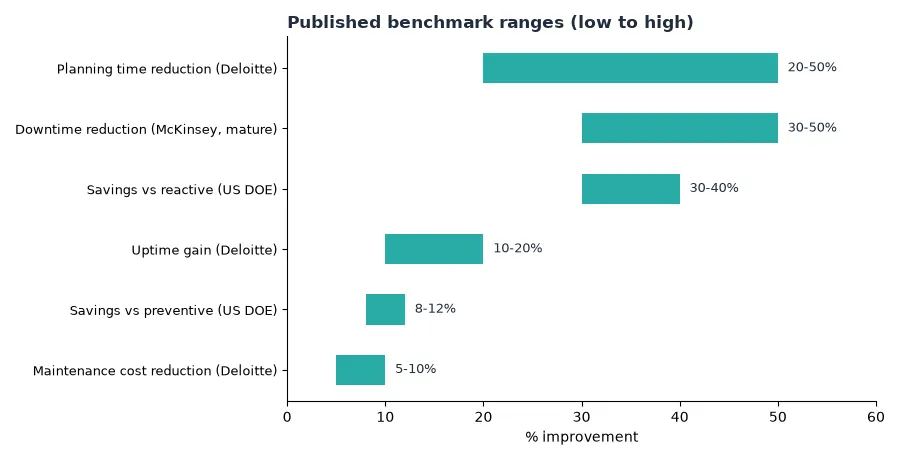
- Deloitte: maintenance costs down 5% to 10%, uptime up 10% to 20%, planning time down 20% to 50%.
- McKinsey (2017): downtime down 30% to 50% in mature programs.
- US DOE: predictive saves 8% to 12% over preventive and 30% to 40% over reactive maintenance.
The famous “10x ROI, 70% fewer breakdowns” list is old, hard to trace and should be cited with care. A Deloitte extruder pilot reported an 80% cut in unplanned downtime and about $300,000 saved per asset, but that is one pilot, not a guarantee.
Read Deloitte’s analysis of AI in predictive maintenance and Reliable Media’s predictive maintenance ROI benchmark review.
A payback calculation you can copy
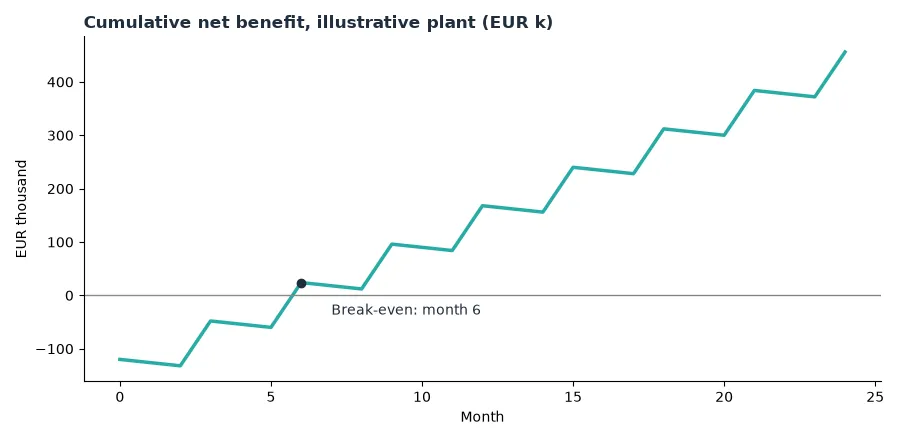
Assumptions (hypothetical)
- EUR 120k setup: sensors, integration and training.
- EUR 6k per month run cost: software and support.
- One avoided 6-hour stop per quarter on a line that loses EUR 15k per hour, i.e. EUR 90k avoided per quarter.
Result and formula
Cumulative net benefit turns positive in month 6 and reaches about EUR 456k after 24 months.
Formula: net benefit = avoided stops × hours × cost per hour − run cost − setup cost.
Over 24 months: 8 × 6 × EUR 15k − 24 × EUR 6k − EUR 120k = EUR 456k. Replace the three assumptions with your own maintenance logs before showing it to finance.
Where to start: 4 steps
- Rank assets by cost of failure, not by age. ARC Advisory data shows only 18% of failures are age related and 82% follow a random pattern, so calendar maintenance misses most of them.
- Pick 3 to 5 critical assets with an existing failure history.
- Instrument them (vibration, temperature, current) and set a baseline for 8 to 12 weeks.
- Measure against the baseline: unplanned stops, emergency work orders and spare parts spend.
4 mistakes that erase the savings
- False alarms: McKinsey reported that a 10% false-positive rate erased the savings of one program.
- No baseline: without a reference, nothing can be proven.
- Too many assets at once: spreading the pilot too widely makes it harder to learn and prove the business case.
- Alerts nobody owns: without a named owner and a link to the work-order system, alerts do not turn into action.
Where AI workers help
AI workers can read alerts, check maintenance history, draft the work order and report monthly savings to finance, so data turns into decisions.
See also our guides on demand forecasting mistakes, AI agent memory architecture and the 5-day month-end close.
Conclusion
Budget on the conservative ranges (5–10% maintenance cost, 10–20% uptime), prove it on a few assets, then scale.