Demand Forecasting: 7 Mistakes That Blow Up Your Inventory
By Henry — 2026-11-03
Most inventory problems start in the forecast process, not in the algorithm. Here are 7 mistakes to fix first.
When a warehouse is full of slow movers while best sellers are out of stock, the instinct is to blame the forecasting model. In practice the model is rarely the weak link. The process around it is: how accuracy is measured, how history is cleaned, how uncertainty is handled. Here are seven mistakes we see again and again, each with a concrete fix.
1. Judging the forecast on a single accuracy number
MAPE (mean absolute percentage error) is the default KPI, but it hides direction. A forecast that is 10% too high every single week can show a MAPE close to that of an unbiased noisy forecast.
In the illustrative 12-week simulation below, Forecast A is noisy but unbiased (MAPE 8%, bias 0%), while Forecast B looks tighter but consistently over-forecasts (MAPE 10%, bias +10%). B piles up roughly 115 surplus units over 12 weeks, about 10% of total demand.
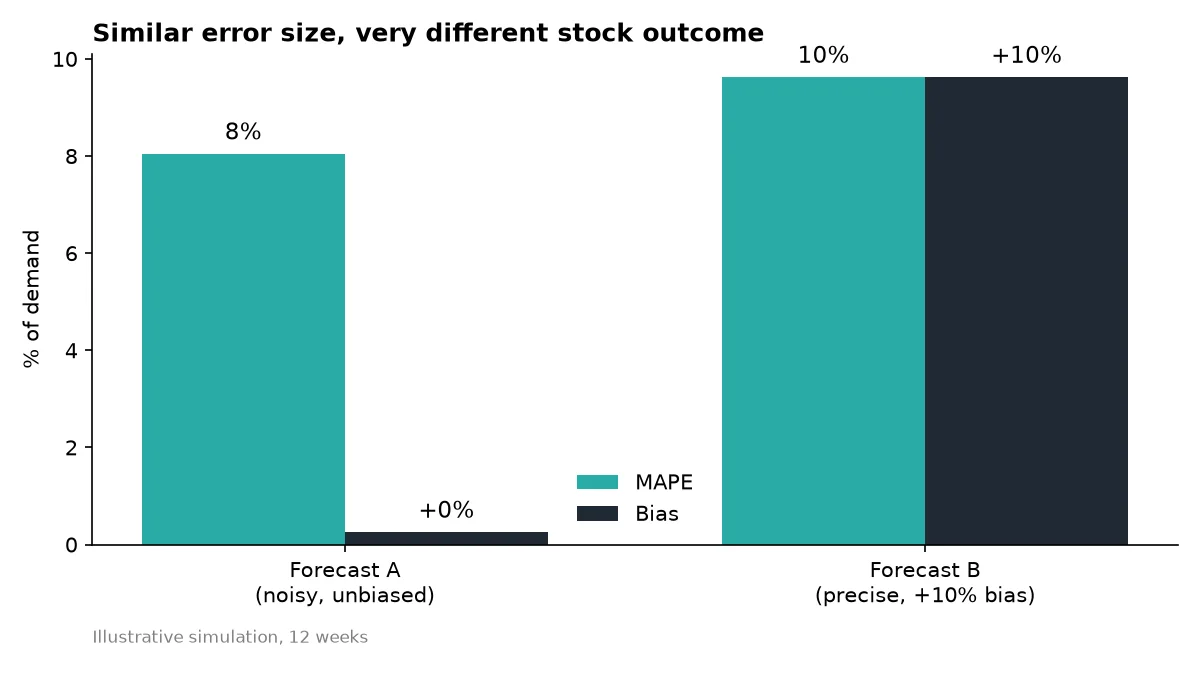
Fix: track MAPE AND bias (signed error) side by side, and review bias first. The figures are an illustrative simulation, not client data.
2. Forecasting at the wrong level
SKU × store × day series are noisy and mostly zeros. Forecast at a family or weekly level, where the signal is stable, then allocate down. Planners often do the opposite and chase noise.
Fix: build a hierarchy (product family, region, week) and reconcile it with the detailed level.
3. Treating sales as demand
When a product is out of stock, sales are zero but demand was not. Feeding those zeros back trains the forecast to expect less, which causes more stockouts (censored demand).
Fix: flag out-of-stock days in history and replace them with an estimate (similar days or neighbouring stores) before training.
4. Leaving one-offs in the history
Promotions, a one-time large order, a strike, a heat wave. If not tagged, the model reads them as a trend.
Fix: keep an event calendar (promotions, price changes, closures) and use it as an explicit input or exclusion.
5. Giving one number instead of a range
A forecast is a best guess, never a certainty. Safety stock should follow forecast error, not a rule of thumb.
With the standard formula SS = z × σ × √lead time, a 95% service level (z = 1.65) and a 4-week lead time, safety stock rises linearly with the weekly error: 33 units at σ = 10 becomes 132 units at σ = 40.
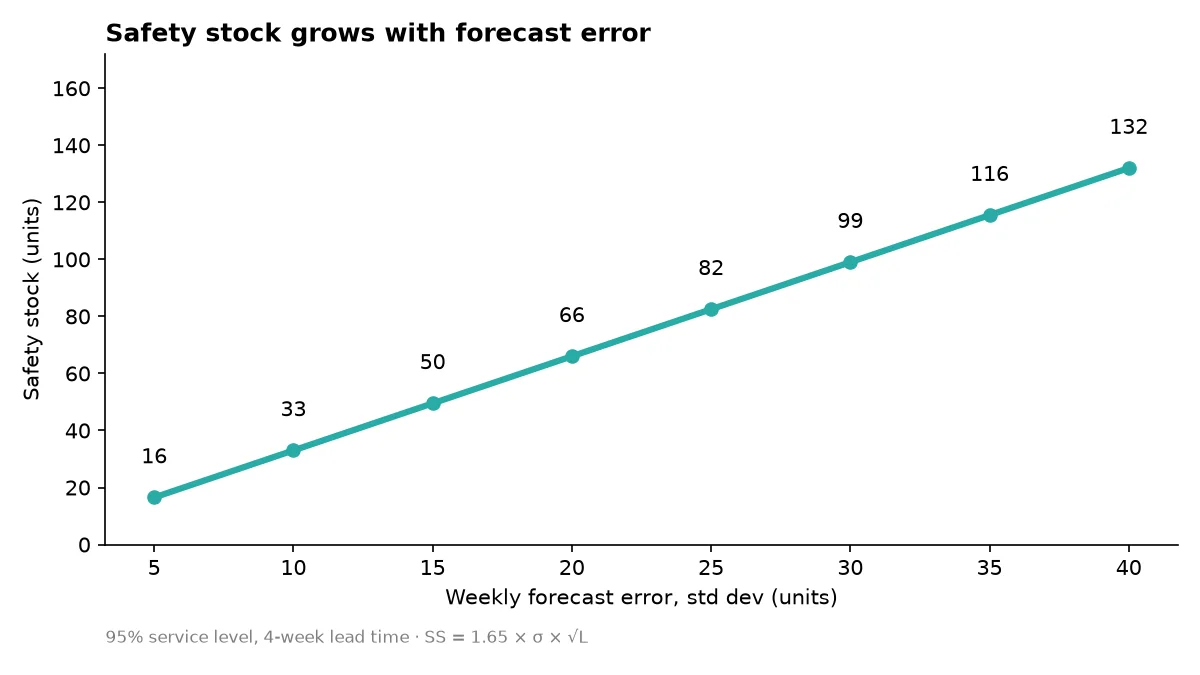
Every point of error you remove frees working capital. See the safety stock definition.
Fix: compute safety stock per item from measured error, and revisit it each quarter.
6. Overriding the forecast without measuring the override
Commercial teams adjust numbers all the time. Some adjustments help, many add noise or optimism.
Fix: measure Forecast Value Added (FVA): compare accuracy of the statistical forecast vs the adjusted one and keep only overrides that beat the baseline.
7. Refreshing too slowly and ignoring the chain
A monthly forecast on a weekly business means decisions on stale numbers. And when each tier orders on its own forecast, small demand changes get amplified upstream: the bullwhip effect.
Fix: refresh weekly, share the demand signal with suppliers, order against a common plan.
A 30-minute weekly routine
- Export last week's sales and stock.
- Flag stockout days.
- Compute MAPE and bias per family.
- List the 10 worst-bias items.
- Check overrides vs baseline.
- Update safety stock for items whose error moved.
This is the kind of repetitive analysis a Delos Worker such as Henry, the Data Analyst, can run on a schedule from your ERP exports, leaving planners to decide. Explore agentic AI enterprise workflows and the month-end close checklist, which uses the same routine + checklist approach in finance.
Conclusion
Forecasting accuracy is a process problem. Start with bias, clean the history, size safety stock on measured error.
Note: charts are an illustrative simulation and a formula-based calculation, not customer data.