OEE Explained: How AI Agents Attack the Six Big Losses on Your Production Line
By Delos — 2026-11-14
Most plants run at 55-60% OEE. Here is how AI agents go after the six big losses, step by step.
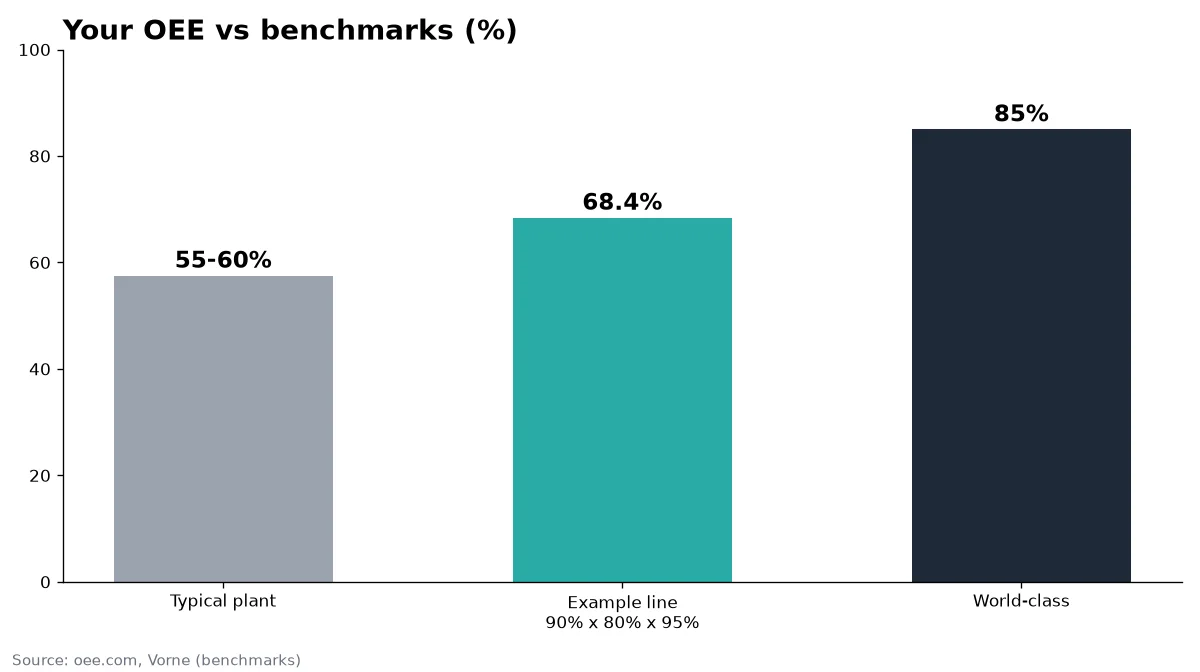
Overall Equipment Effectiveness (OEE) is the one number that tells you how much of your planned production time is truly productive. The formula is simple: Availability x Performance x Quality. The reality is less comfortable: the commonly quoted world-class benchmark is 85%, while typical plants hover around 55-60%, and only about one manufacturer in ten reaches 85% (oee.com and Vorne benchmark analyses). The gap is lost output you already pay for.
What OEE actually measures
OEE splits losses into three factors (oee.com): Availability (run time divided by planned production time), Performance (net run time divided by run time) and Quality (fully productive time divided by net run time). Take a line with 90% availability, 80% performance and 95% quality: 0.90 x 0.80 x 0.95 = 68.4%. Nothing looks dramatic in any single factor, yet nearly a third of planned time is wasted.
The six big losses, and who owns each
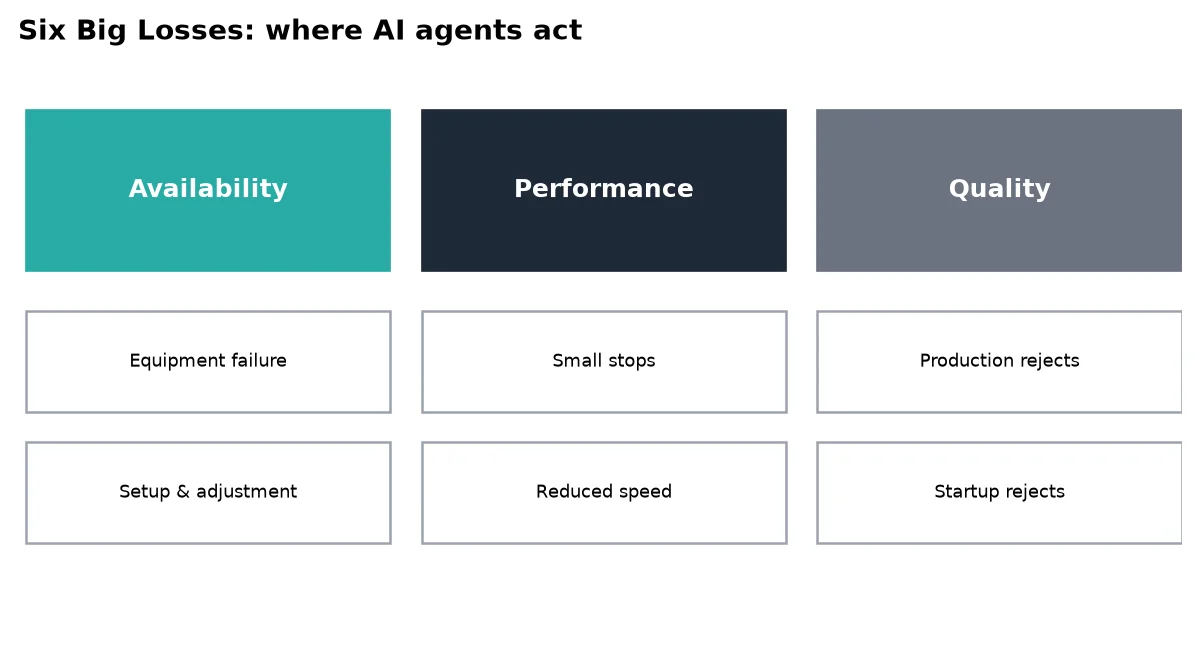
The classic framework groups losses into six categories: equipment failure and setup/adjustment (availability); small stops and reduced speed (performance); production rejects and startup rejects (quality). The point of the framework is that every minute of waste lands in exactly one bucket, so each bucket can have an owner and an action.
Where AI agents help
Availability: fewer surprises, faster changeovers
Agents read maintenance logs, alarm histories and operator notes, flag recurring failure patterns and draft the work order before the shift starts. For setups, they assemble the changeover checklist, parts list and settings from the last successful run. Pair this with a sound maintenance strategy (see our guide on predictive maintenance ROI).
Performance: make small stops visible
Micro-stops of under five minutes are rarely logged by hand, which is why they are called the hidden factory. An agent that consumes machine counters and operator comments can cluster stops by cause and show that, say, 40% of lost minutes come from one jam point. Reduced speed shows up the same way: ideal cycle time versus actual, per product reference.
Quality: catch drift before scrap
Agents correlate process parameters with reject data to warn when a setting drifts, and summarise startup rejects by changeover so teams adjust recipes. For inspection itself, see AI visual inspection in manufacturing.
A 5-step rollout that works
- Measure at the constraint. OEE should be measured at the step that governs throughput, as the oee.com FAQ recommends (source).
- Fix your definitions. Agree on planned stops, ideal cycle times and what counts as a reject before automating anything.
- Connect the data you already have. Start with machine counters, downtime reasons and maintenance tickets, not new sensors.
- Give each loss an owner and a weekly review. Let the agent prepare the Pareto of losses and propose three actions; people decide.
- Track the three factors, not just the total. A rising OEE can hide a quality decline.
Do not chase 85% blindly
The 85% figure is a reference, not a universal target: the oee.com FAQ itself states that world-class OEE is not necessarily your goal, because the right level depends on your process. Use your own baseline, and aim for steady gains on the biggest loss first. Handover quality between shifts also matters; see AI agents for shift handover.
Key takeaways
- OEE = Availability x Performance x Quality; typical plants sit at 55-60%.
- Six big losses give each wasted minute one owner.
- AI agents are strongest at making small stops, drift and recurring failures visible and actionable.
- Start with the data you have, measured at the constraint.